Blog
July 24, 2025
Tutorial: Visualize Your Puppet Data in Grafana with the Observability Data Connector

Ecosystems & Integrations,
DevOps,
How to & Use Cases
When you manage complex IT infrastructure, it becomes critical to use tooling to understand what’s happening across all of your systems in terms of performance, reliability, and compliance. Monitoring key indicators manually is simply no longer possible at that scale. Puppet has long been known as a solution for managing large environments and collecting a vast amount of data about your infrastructure, but accessing and visualizing that data in a meaningful way can be a challenge.
The Observability Data Connector, part of the Puppet Enterprise Advanced package, can be used to export Puppet data for use with popular observability tools like Prometheus and Grafana. After installing and configuring the module, you and your team can visualize Puppet activity, monitor trends, and make data-driven decisions using the tools you already know.
This tutorial takes you through the full process, from module installation to using the Puppet infrastructure data in Grafana, so you can get started visualizing your Puppet estate.
Prerequisites
- This tutorial assumes a Linux file system for its examples. You might have to adjust the instructions for other operating systems.
- Ensure that you can access the Observability Data Connector, since it is a premium module with restricted access. For more information, see Observability Data Connector: Export Puppet to Splunk & More.
- Download the module. For more information about downloading premium modules, see Premium modules on the Forge · Puppet Forge.
🎦 Do you prefer video? We have a short video walkthrough that you can watch now!
Back to top
Step-by-Step Tutorial: Setting Up the Observability Data Connector
Puppet has an immense amount of data. Puppet Facts on each server can number in the hundreds and have always been available on the Puppet console or through the API. Now, you can socialize that data to everyone by using the Observability Data Connector.
Back to topStep 1: Install the Module
The Observability Data Connector is distributed as a premium Puppet module and is available on Puppet Forge. Our first step will be to install the module in our Puppet Server.
ℹ️ What You’ll Do in This Step:
- Add the module to your control repository.
- Deploy it using your standard Puppet workflow.
📝Instructions:
- Open your control repository at your command line (example: ~/dev/control-repo).
Open the Puppetfile:
vi PuppetfileAdd the module reference:
mod 'puppetlabs/puppet_data_connector', 'x.y.z'ℹ️ Replace 'x.y.z' with the latest version available on the Forge.
- Deploy the module by using your code deployment tool (for example, Code Manager or r10k). You can follow these official product docs for how to deploy your changes in different ways:
Step 2: Create a Profile Class
To add configurations to the module in a code-based approach, you will use a profile class. Out of the box, you can use the Puppet Enterprise console to configure values for the module by using the default profile class, but in this tutorial, you will use a code-based approach with your own custom profile class.
ℹ️ What You’ll Do in This Step:
- Create a profile class.
- Add configurations for stale_time and drop_zone settings.
📝Instructions:
At your command line, in the control-repo, create a profile file:
vi site-modules/profile/manifests/pe/data_collector.ppCreate a class in the data_collector.pp file.
class profile::pe::data_collector {
}
Add logic to set a stale time. This is the number of seconds before a non-responsive node is purged from Puppet.
class profile::pe::data_collector {
   # Number of seconds before a non-responsive node is purged from puppet, use the same value for the
   # data connector, just converted to seconds
   $ttl = Integer(lookup('puppet_enterprise::console_services::no_longer_reporting_cutoff', { 'default_value' => 3600 }))

   if $ttl {
      $stale_time = $ttl / 60 / 60
   } else {
      $stale_time = undef
   }
}
Inside the class, declare the puppet_data_connector with parameters. Here, you declare the Puppet data connector class and specify a drop zone directory. That’s the location where Prometheus will put the files that it will serve on its endpoint. You will also set the stale time to the one calculated in the previous step.
   class { 'puppet_data_connector':
      dropzone  => '/opt/puppet_data_connector',
      stale_time => $stale_time,
   }
ℹ️ Your final class should look something like this example:class profile::pe::data_collector { # Number of seconds before a non-responsive node is purged from puppet, use the same value for the # data connector, just converted to seconds $ttl = Integer(lookup('puppet_enterprise::console_services::no_longer_reporting_cutoff', { 'default_value' => 3600 })) if $ttl { $stale_time = $ttl / 60 / 60 } else { $stale_time = undef } class { 'puppet_data_connector': dropzone => '/opt/puppet_data_connector', stale_time => $stale_time, } }
Step 3: Classify the Puppet Server
To activate the connector, you will classify your Puppet Server so it will use the module and the profile class you created on the specific nodes/servers/resources that you want to observe. Now that the profile class is defined, you will use the Puppet Enterprise interface, also known as the console, to group and classify nodes and then apply the changes to the Puppet Server.
ℹ️ What You’ll Do in This Step:
- Create a Classification node group and add the Puppet Server to it.
- Assign the class to your Puppet Server node and update the server with the changes.
📝Instructions:
- Log in to the Puppet Enterprise console.
- Create a Classification Node Group by clicking Node groups in the menu and clicking Add group.
- Parent name: All Nodes
- Group name: Observability
- Environment: Production
- Environment group: Do not select
- To create the node group, click Add.
- In the new node group, navigate to the Classes tab.
- Add the class profile::pe::data_collector to the list of classes that will be applied to all nodes in this group.
- Add the Puppet Server to the group by using the static approach for adding nodes to a node group. Within the new group, click on the Rules tab.
- Enter the Puppet Server’s certname in the Certname field.
- Click Pin node and commit the changes.
- To apply the changes, run Puppet on the Puppet Server by clicking Run Puppet. For details, see Running Puppet from the console.
Step 4: Verify Data Collection
After the module is active, it will begin exporting data from Puppet runs into the specified drop zone. You will now validate that your Puppet data is exporting into the correct output folder.
ℹ️ What You’ll Do in This Step:
- Confirm that data is being written.
- Understand the format and structure.
📝Instructions:
- Connect to your Puppet Server and open the command line.
Navigate to the drop zone directory:
cd /opt/puppet_data_connector/dropzoneList the contents of the directory:
ls -ltrYou should see one file per Puppet agent (node or server). These files are in Prometheus format.
Open one of the files, for example:
less puppet.lab.albastrossflavour.com.yamlYou should see data in a standard Prometheus format that can now be passed to other systems like Splunk, Grafana, Datadog, or Microsoft Power BI.
Confirm that the Exporter service (puppet_data_exporter) is running by sending a request to the endpoint (default port is 9100):
curl http://localhost:9100/metricsYou should see the Puppet-exported metrics.
During these steps, if you are not seeing what is expected, then something has gone wrong in the configuration and must be investigated.
Step 5: Set Up a Prometheus Service to Share the Data
After the module is installed and running, the data about your nodes will now be available to share to other systems. However, Grafana can’t read the data directly from the Puppet server, so you will now take the step to expose the observability data files to other tools. In this step, you will use a Prometheus server to expose an endpoint for the metrics data.
ℹ️ What You’ll Do in This Step:
- Install a Prometheus server.
- Configure the Prometheus server to serve the observability data.
📝Instructions:
- Add the Prometheus module from the Forge.
Configure the Prometheus service to scrape the exporter:
class { 'prometheus::server':
   version        => '2.52.0',
   scrape_configs => [
      {
         job_name        => 'puppet_observability',
         scrape_interval => '15s',
         static_configs  => [
            {
               targets => ['localhost:9100'],
               labels  => { alias => 'puppet_observability' },
            },
         ],
      },
   ],
}
Start the Prometheus service on the Puppet server:
systemctl enable –now Prometheus
systemctl enable –now puppet_data_exporter
Validate that the Prometheus service is running and targeted at the exporter by accessing the following URL in a browser, where <PUPPET_SERVER> is the name of the Puppet Server:
http://<PUPPET_SERVER>:9090/targets
Step 6: Integrate with Grafana for Visualization
Now that data is being collected, you can visualize it by using Grafana, which supports Prometheus as a data source. To access Grafana, you can spin up a free Grafana Cloud instance. If you cannot use a cloud-based option, check out the Grafana module on the Forge to install your own.
ℹ️ What You’ll Do in This Step:
- Connect Grafana to your Puppet Server.
- Build dashboards to visualize Puppet activity.
📝Instructions:
- In Grafana, go to Connections in the navigation pane and add a Prometheus type of connection as a new Data Source. See the Grafana docs on configuring a data source for detailed steps.
Give the data source a name like puppet-metrics and set the URL to point to your Puppet Server’s Prometheus endpoint (where the .prom files are served). The default is similar to
http://<PUPPET_SERVER>:9090.- If authentication is required to connect to your Puppet Server’s Prometheus endpoint, configure the authentication method.
- Create a dashboard and add panels by using Prometheus queries like the following:
- puppet_run_duration_seconds
- puppet_resource_changes_total
- puppet_last_run_timestamp
- Use Grafana’s filtering and time-series capabilities for the following tasks:
- Monitor run durations over time.
- Detect spikes in resource changes.
- Identify failed runs or anomalies.
When you view Grafana’s dashboard for a single node, you can see how long it's been since the last report, what events have happened, and how many resources are being managed over time.
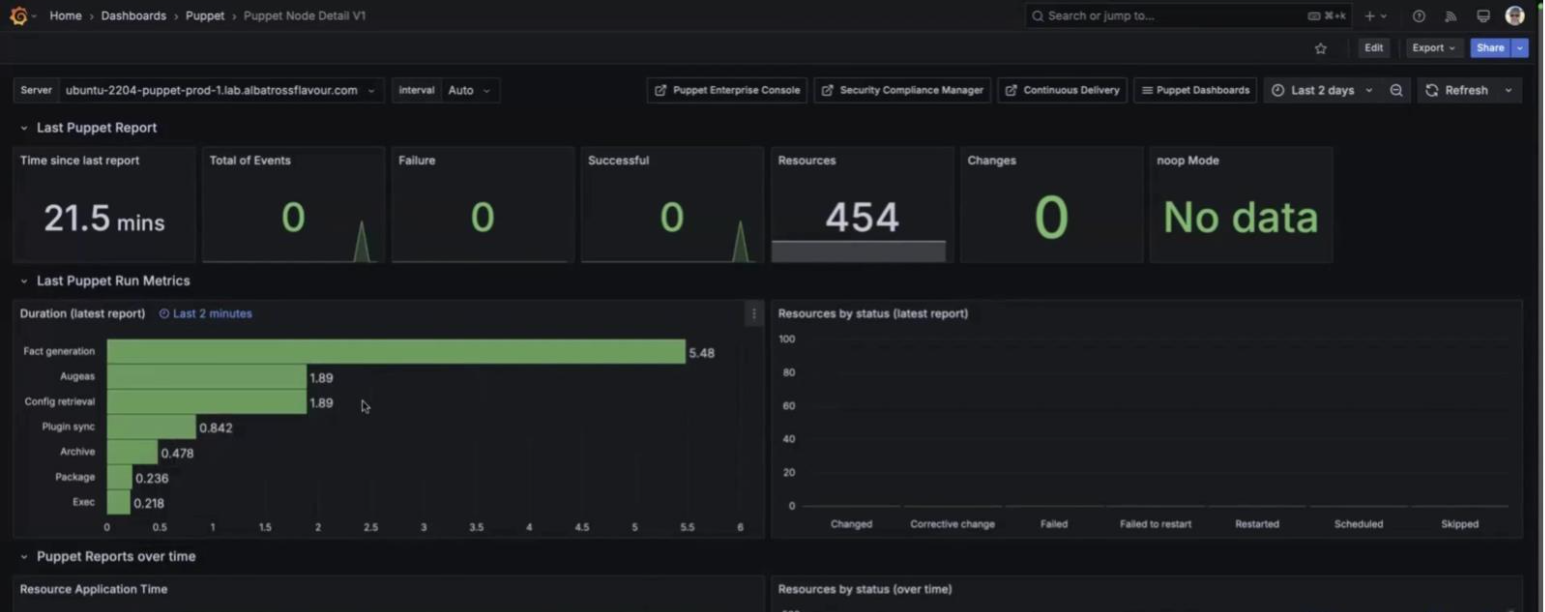
You can also see how long each action took. For example, this screenshot shows:
- Fact generation took more than 5 seconds.
- Config retrieval took 1.89 seconds.
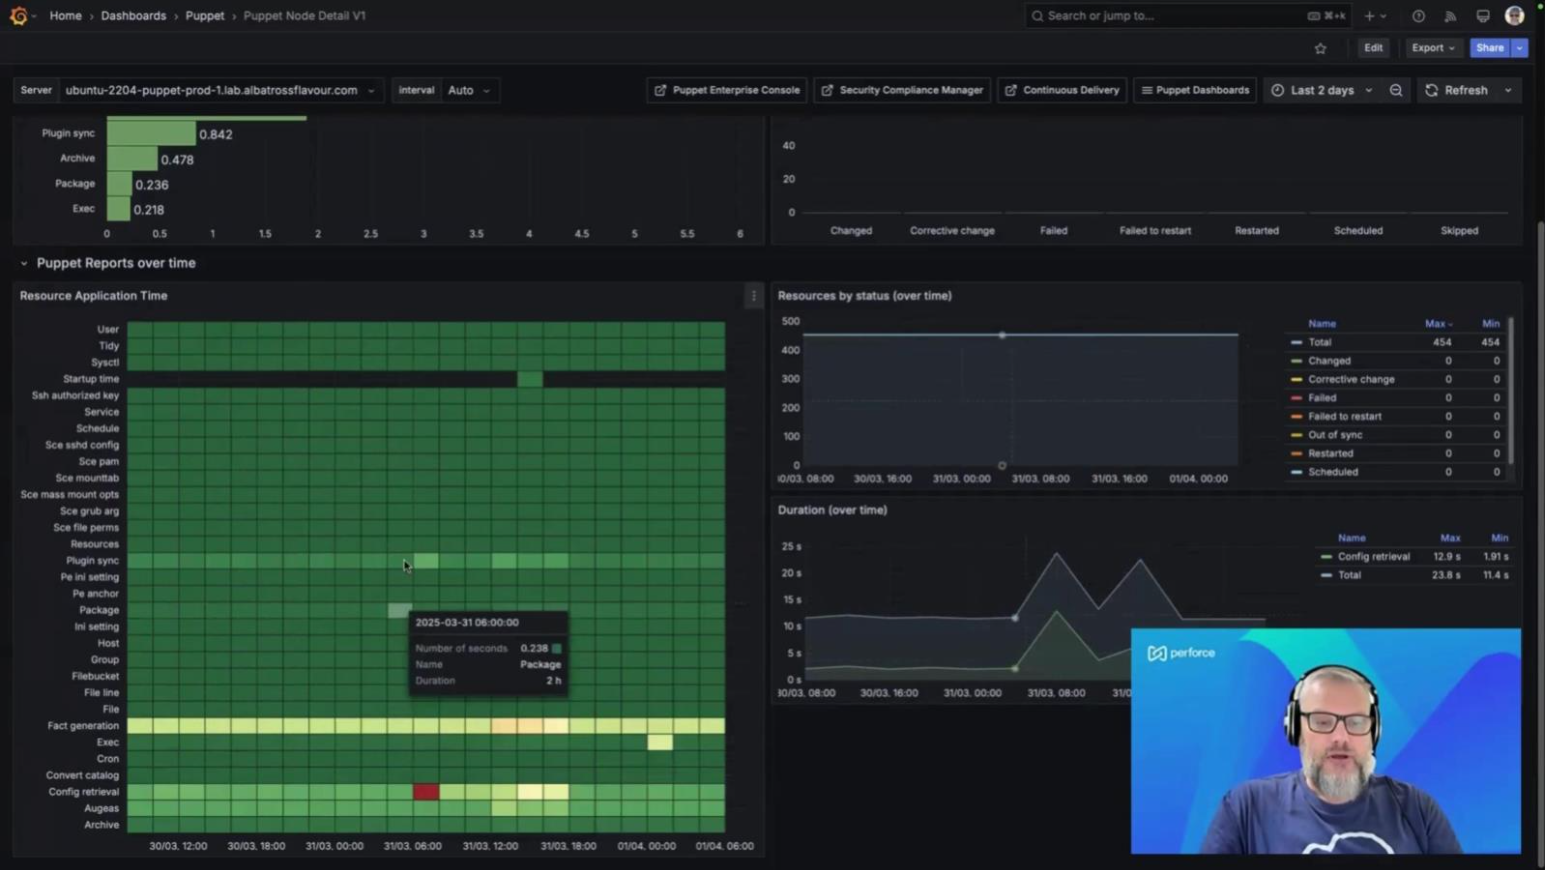
You can also view information over time. In the following sample view, a large spike in config retrieval is marked by a red rectangle. You can also review duration and resource enforcement over time.
Back to top
Step 7: Scale and Customize
After you have basic dashboards, you can also expand and tailor them to fit your monitoring needs.
✅ What You Can Do:
- Filter by environment (for example: production or staging).
- Aggregate data across all nodes.
- Create alerts for failed runs or long durations.
- Export data to other tools like Splunk or Power BI.
🛠 Tips:
- Use Grafana variables to switch between environments or node groups.
- Combine Puppet metrics with infrastructure metrics for a holistic view.
- Set up alerts in Grafana to notify you of anomalies in Puppet behavior.
Wrapping it all up
Congratulations on getting set up for viewing data in Grafana! In this tutorial you:
- Added the Observability Data Connector module through a Puppetfile.
- Created a code-based profile and then classified your Puppet Server using the Puppet Enterprise UI and node groups.
- Validated that your metrics were being dropped into your drop zone on disk.
- Configured a Prometheus server to expose your metrics.
- Configured Grafana to read your data from your Prometheus server.
Tapping into the Observability Data Connector makes it easier to expose all of the data that Puppet collects so you can bring it into your existing observability stack. In just these few steps from this tutorial, you can go from raw Puppet data to powerful, actionable dashboards that help your teams monitor, troubleshoot, and optimize your infrastructure.
Back to topRelated Links
- Observability Data Connector (forge.puppet.com)
- Managing modules with a Puppetfile (help.puppet.com)
- Triggering Code Manager on the command line (help.puppet.com)
- Triggering Code Manager with a webhook (help.puppet.com)
- Deploying environments with r10k (help.puppet.com)
- Grouping and classifying nodes (help.puppet.com)
- Create classification node groups (help.puppet.com)
- Statically add nodes to a node group (help.puppet.com)
- Running Puppet from the console (help.puppet.com)
- Prometheus module for Puppet (forge.puppet.com)
- Prometheus installation (prometheus.io)
- Configure a Prometheus data source in Grafana (grafana.com)