
Blog
July 7, 2026
Driving Value from Puppet Metrics: Puppet Observability Data Connector

How to & Use Cases
What is the Puppet Observability Data Connector?
The Puppet Observability Data Connector is a premium Forge module included with Puppet Enterprise Advanced (PEA). This module provides a deeper dive into your Puppet agent reports. Visualizing these metrics gives you a great way to identify what is healthy and unhealthy in your environment.
Behind the scenes, this module provides 2 core functionalities.
- It provides a report processor to convert Puppet reports into usable metrics.
- It manages an exporter to serve these metrics for your time series database to scrape.
Example Metrics
- Failed nodes
- Changed nodes
- Catalog cache failures
- Stale nodes
- Corrective changes
- Out of sync resources
- Average total run time
- Max run time
- Run time breakdowns
- Total run time
- Fact generation time
- Catalog application time
- Config retrieval time
- Plugin sync time
- Convert catalog time
- Managed resource count by host
- Managed resource count over time
- Catalog application time trends
Using the metrics provided by Puppet Observability Data Connector, you can make impactful dashboards. Below are some examples that I have created.
Note: All dashboards can be filtered by the environment and/or host. All thresholds for color coding can be modified to fit your environment.
Back to topFleet Status Dashboard Example
This example ‘Fleet Status’ dashboard provides an always-open first-look insight into whether anything in your fleet requires immediate attention. I will break this down by section
When to Use a Fleet Status Dashboard?
- After deploying Puppet code to confirm no regressions
- During incidents to identify affected nodes
- As part of a daily ops review to verify fleet-wide compliance
Fleet Health Summary (stat panels)
A top-level count of nodes in each state from the most recent run. Six stats that give you an instant fleet pulse without scrolling.

What this tells you:
| Total Nodes Reporting | Quantity of nodes submitting reports, this number should be 1:1 with the amount of puppet agent managed nodes in your environment |
| Failed Nodes | Nodes where puppet_status{state="failed"} == 1; any non-zero value requires immediate investigation |
| Changed Nodes | Nodes where Puppet applied changes in the last run; expected after a code push, unexpected otherwise |
| Unchanged Nodes | Nodes fully converged — your desired steady state |
| Catalog Cache Failures | Nodes that could not obtain a fresh catalog and fell back to a cached one. Triggers on server/network unreachable or any catalog compilation error (duplicate resource declaration, undefined variable, syntax error, missing module) |
| Stale Nodes (>2h) | Nodes that haven't reported in over two run intervals; the agent may be down, hung, or disconnected |
Node Run Status (bar gauges)
Per-node breakdowns of the two most critical run-level signals.
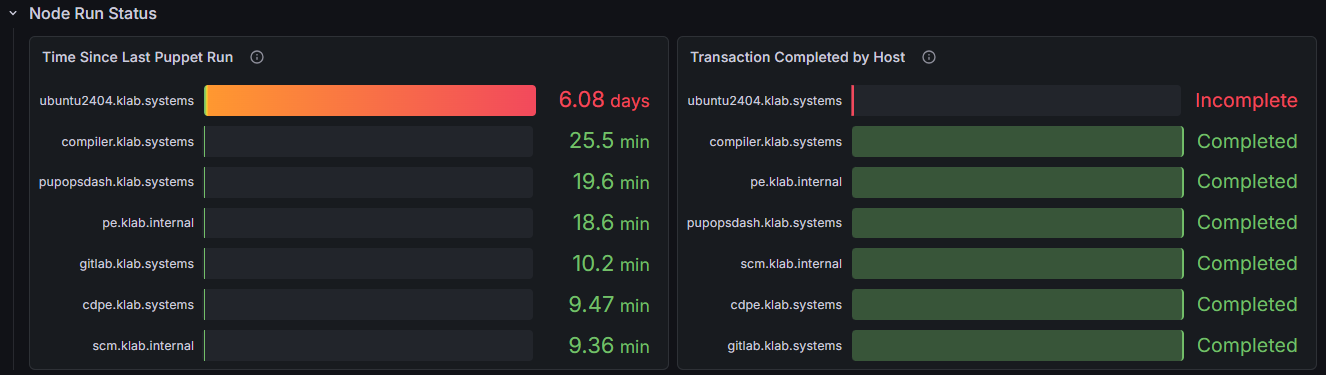
What this tells you:
| Time Since Last Puppet Run | Minutes since each node last phoned home. Green = within one run interval (~30 min), yellow = approaching stale, red = definitely stale. Use to find silent failures where the agent has stopped running entirely. |
| Transaction Completed by Host | Whether the last run completed (1) or was aborted mid-run (0). An aborted transaction means the node's actual state is unknown — treat it the same as a failure. |
Compliance & Drift (stats + bar gauges + time series)
This section separates intentional changes (deployments) from unintentional drift (external actors modifying managed state).
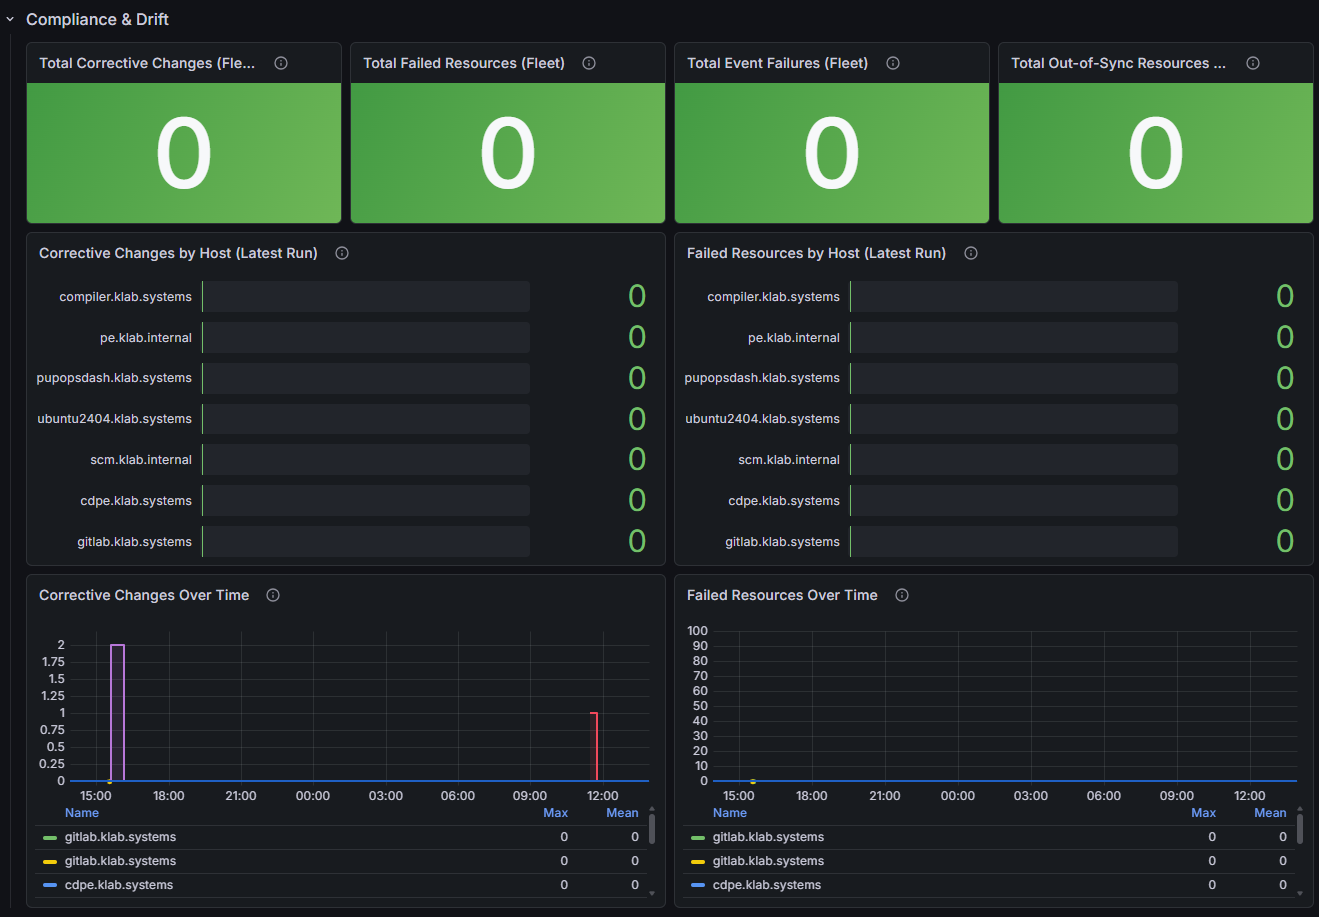
What this tells you:
| Total Corrective Changes (Fleet) | Aggregate count of corrective changes across all nodes. A corrective change means Puppet found a resource in the wrong state and fixed it — something external changed it. Persistent non-zero values are a compliance red flag. |
| Total Failed Resources (Fleet) | Resources that Puppet attempted to enforce but could not. Non-zero always warrants investigation. |
| Total Event Failures (Fleet) | Resource-level event failures, which can appear even on nodes not marked failed. Catches partial failures. |
| Total Out-of-Sync Resources (Fleet) | Resources declared in the catalog but not yet in the desired state. Elevated values indicate pending convergence or a broken dependency chain. |
| Corrective Changes by Host | Identifies which specific nodes are experiencing drift. Nodes with persistent corrective changes may have rogue processes or manual interventions overwriting Puppet-managed state. |
| Failed Resources by Host | Identifies which nodes have broken resources. Cross-reference with the node'sPuppet report for the specific resource type and error message. |
| Corrective Changes Over Time | Trend view — spikes correlate with manual changes, automated tooling conflicts, or software self-repair mechanisms overwriting managed files. |
| Failed Resources Over Time | Trend view — a step-change increase after a code push indicates a bug in new Puppet code. A gradual increase may indicateenvironment drift. |
Catalog Cache Status (stats + bar gauge)
Catalog cache usage is a leading indicator of Puppet infrastructure health, often surfacing issues before nodes start failing outright.
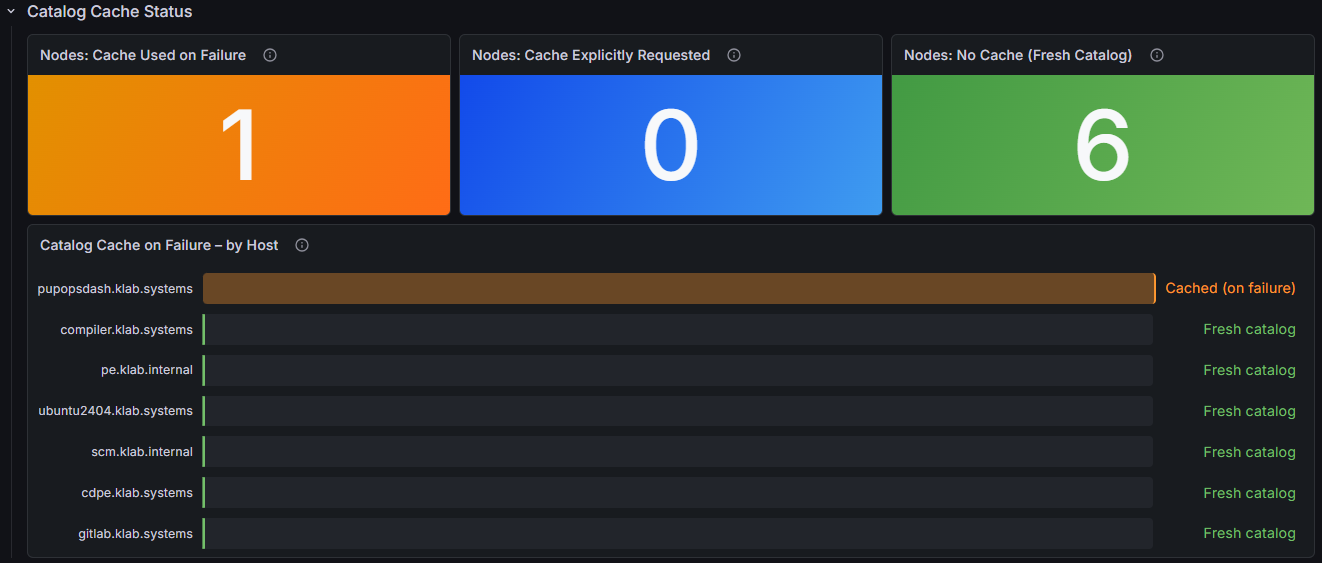
What this tells you:
| Nodes: Cache Used on Failure | A fresh catalog could not be obtained. Common causes: Puppet server unreachable, network failure, or a catalog compilation error (duplicate resource declaration, undefined variable, syntax error, missing module). The node ran with a potentially stale catalog — investigate PE server logs and the agent's last run report. |
| Nodes: Cache Explicitly Requested | Nodes intentionally running offline (e.g., --use-cached-catalog). Expected during planned maintenance; unexpected otherwise. |
| Nodes: No Cache (Fresh Catalog) | Healthy nodes compiling a fresh catalog every run — your desired steady state. |
| Catalog Cache on Failure – by Host | Pinpoints which nodes are falling back to cache. Use to determine whether it's a widespread compiler/network issue or a node-specific catalog compilation error (check that node's agent log for the exact cause). |
Full Dashboard Snapshot
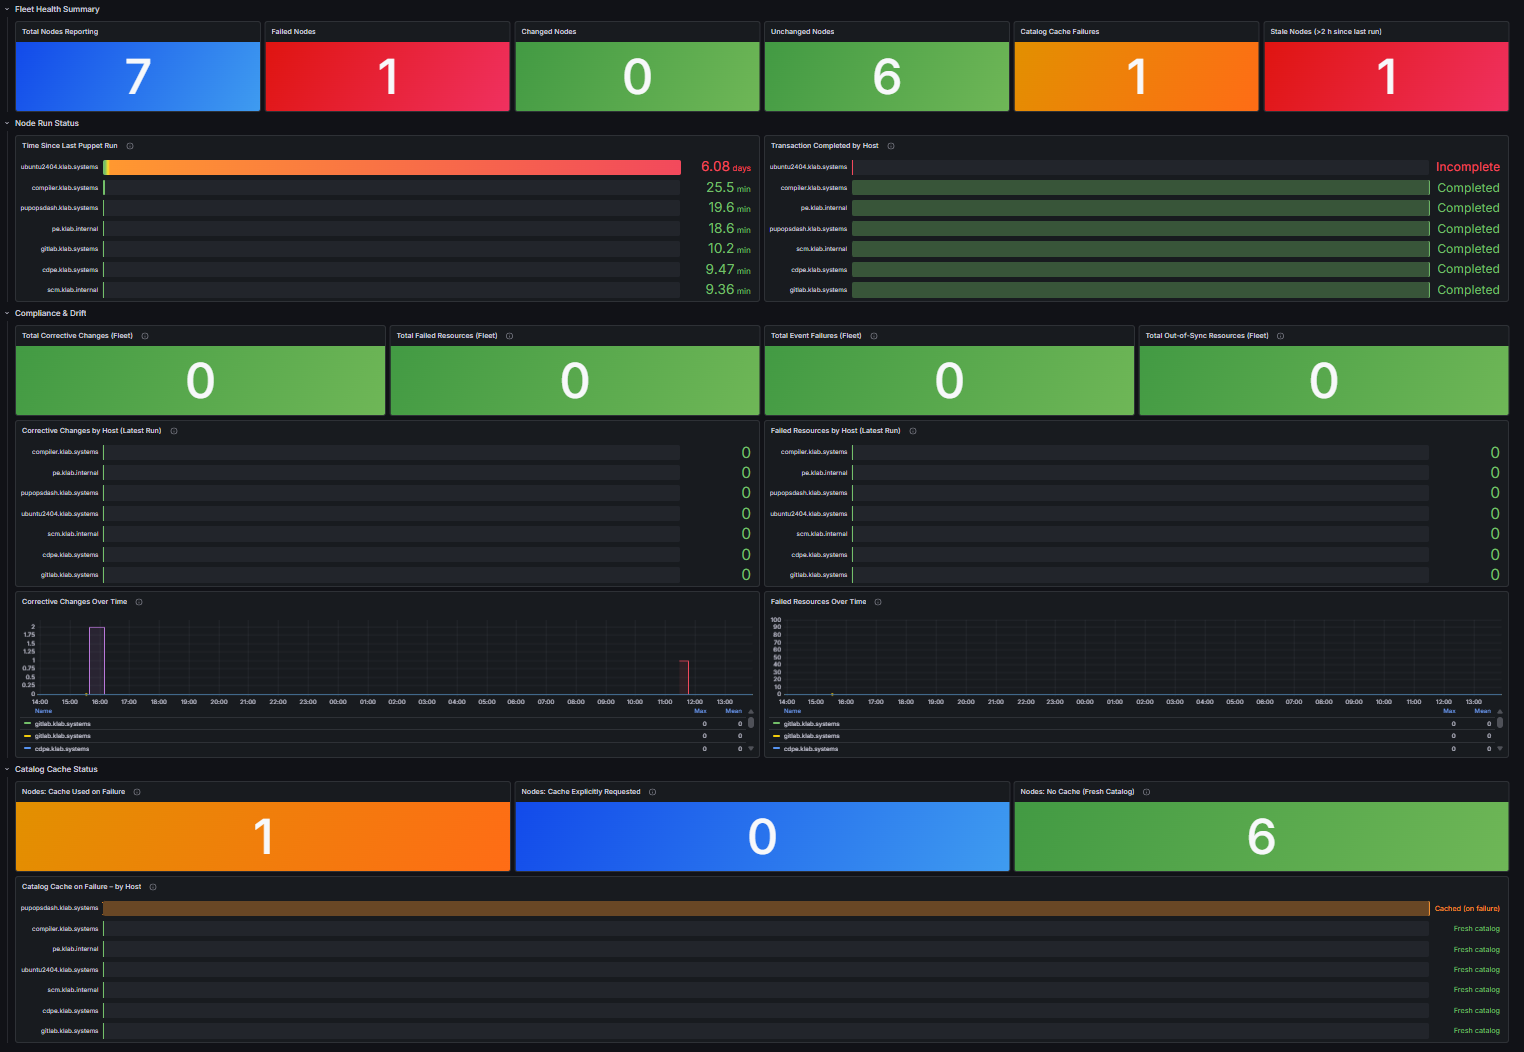
Back to top
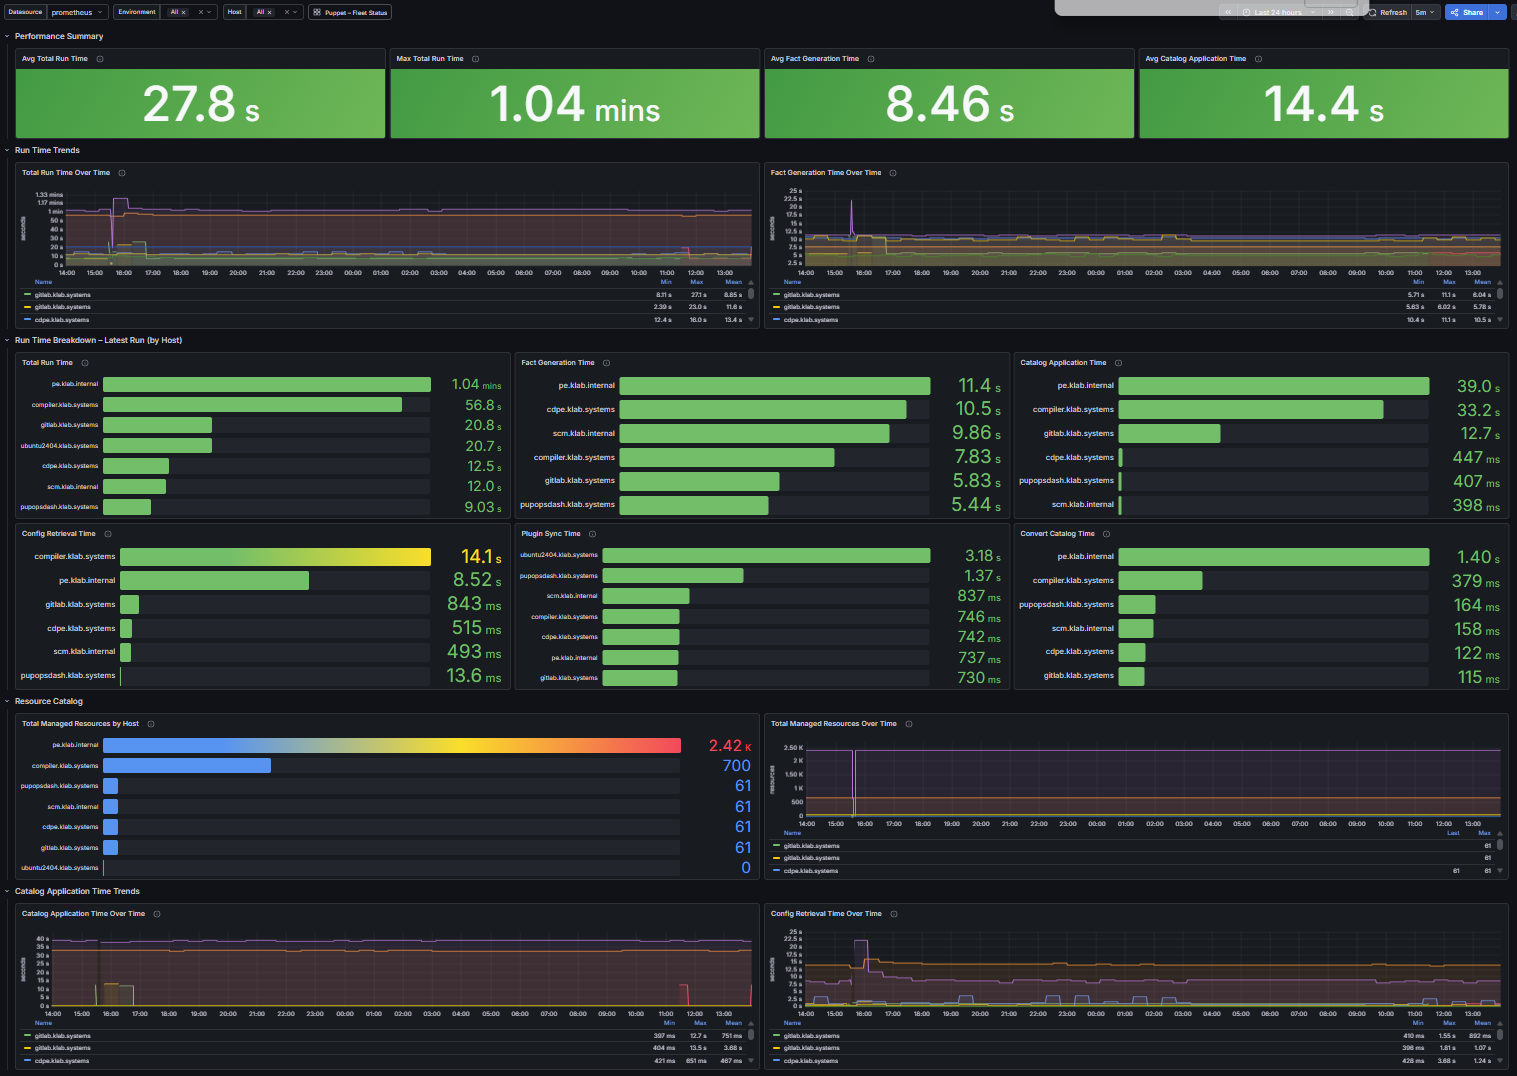
Run Performance Example Dashboard
This example ‘Run Performance’ dashboard acts as your performance and capacity planning dashboard. It answers whether Puppet is running efficiently and helps you locate bottlenecks before they become outages. I will break this down by section.
When to use a Run Performance dashboard?
- Run times are creeping up across the fleet
- After adding new modules or resource types to identify compile/apply costs
- To compare performance across environments (production vs. feature_demo)
- When planning infrastructure scaling (for example, adding more compilers or faster agents)
Performance Summary (stat panels)
Fleet-wide performance KPIs. These numbers represent your overall SLA for Puppet run completion.

What this tells you:
| Avg Total Run Time | The mean end-to-end run duration across all selected nodes. Green < 120s, yellow 120–300s, red > 300s. |
| Max Total Run Time | The slowest node in the fleet — identifiesoutliers dragging down SLA. |
| Avg Fact Generation Time | How long facter is taking on average. This phase runs before catalog compilation so delays here block everything downstream. |
| Avg Catalog Application Time | How long Puppet spends enforcing resources. A reliable proxy for catalog complexity and system responsiveness. |
Run Time Trends (time series)
Long-term trend views to distinguish persistent regressions from one-off anomalies.
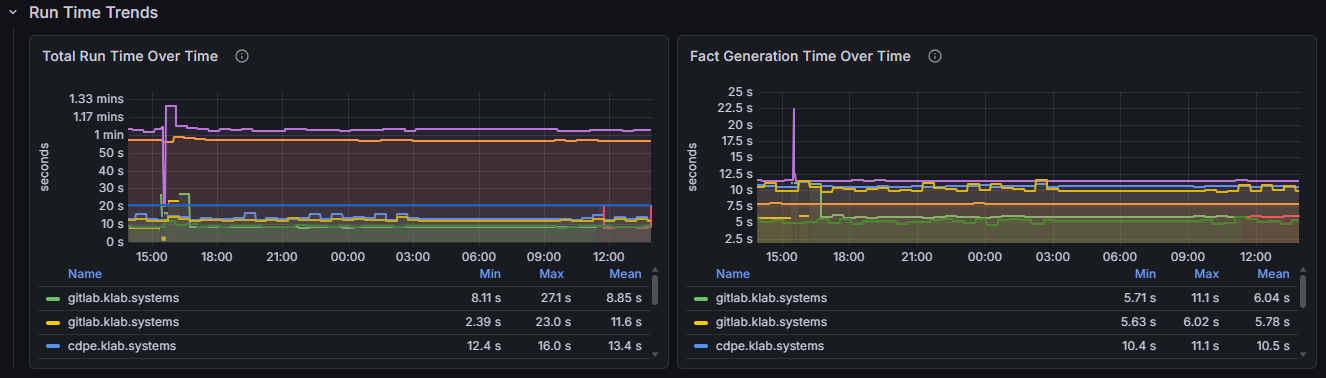
What this tells you:
| Total Run Time Over Time | The most important single trend. A sudden step-change after a deployment indicatesnew expensive resources. A gradual increase over weeks suggests catalog bloat or system degradation. A red threshold line at 300s provides a visual SLA boundary. |
| Fact Generation Time Over Time | Isolates facter performance from the rest of the run. Upward trends often indicatenew custom facts, growing hardware inventories, or external fact sources becoming slow. |
Run Time Breakdown – Latest Run (by Host) (bar gauges)
Per-node, per-phase timing from the most recent run. Use this to pinpoint which phase is slow on which node rather than just knowing the total is high.
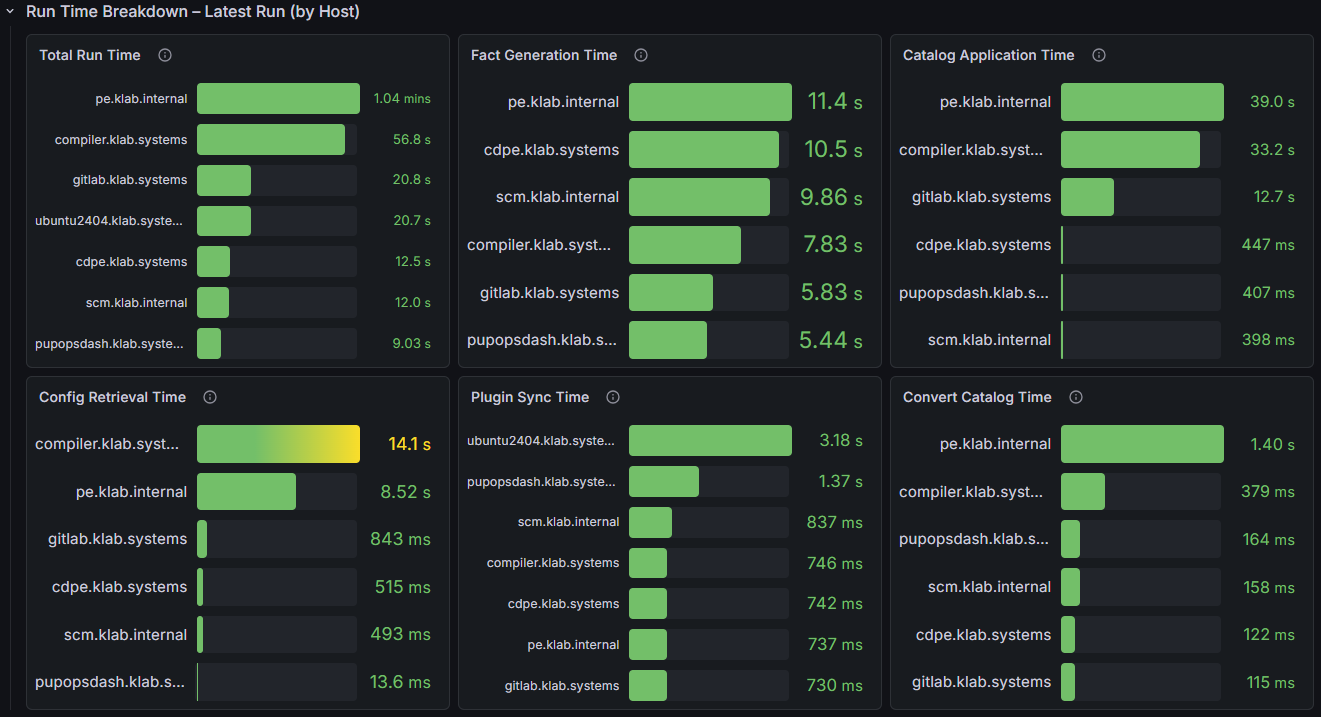
What this tells you:
| Panel | Phase | Optimization Lever |
| Total Run Time | End-to-end wall clock | — |
| Fact Generation Time | Running facter | Audit custom facts; disable unused external facts |
| Catalog Application Time | Enforcing all resources | Reduce catalog size; identify slow resource types (Package, Exec) |
| Config Retrieval Time | Fetching compiled catalog from PE server | Scale compilers; check network latency between agent and server |
| Plugin Sync Time | Downloading Puppet functions/types/providers | Audit and prune modules; check if all plugins are necessary |
| Convert Catalog Time | Transforming compiled catalog into apply-ready format | Indicates catalog structural complexity |
Resource Catalog (bar gauge + time series)
Catalog size is the root cause of many performance problems. These panels correlate resource count with run time.
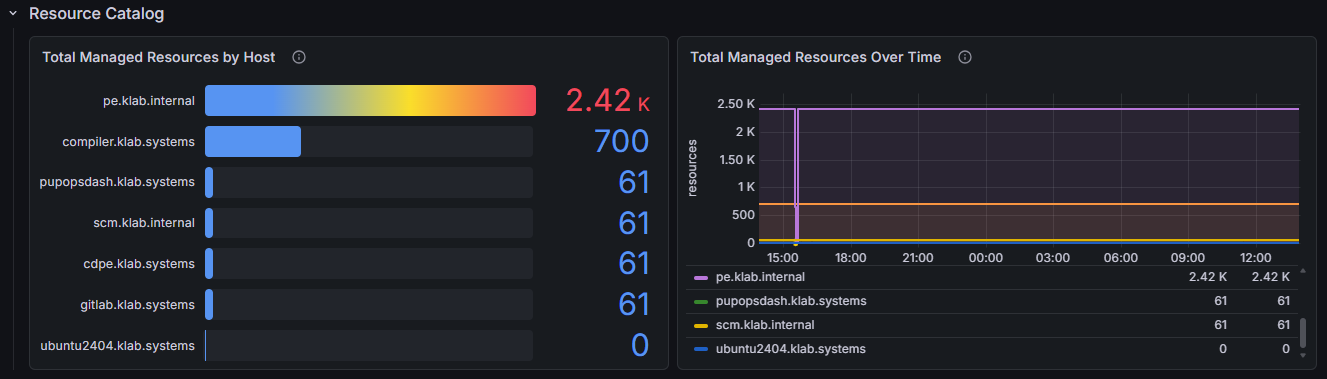
What this tells you:
| Total Managed Resources by Host | Nodes with significantly more resources than peers warrant investigation — are all those resources intentional? pe.klab.internal managing 2,419 resources vs 61 for simpler nodes is expected for a PE server; unexpected divergence between similar nodes is not. |
| Total Managed Resources Over Time | A sudden jump indicates a code change added many new resources. Gradual growth over months indicates catalog bloat — exported resources collecting without cleanup, or defined resource types generating more instances than expected. |
Catalog Application Time Trends (time series)
Deeper trend analysis for the two phases most sensitive to infrastructure and code changes.
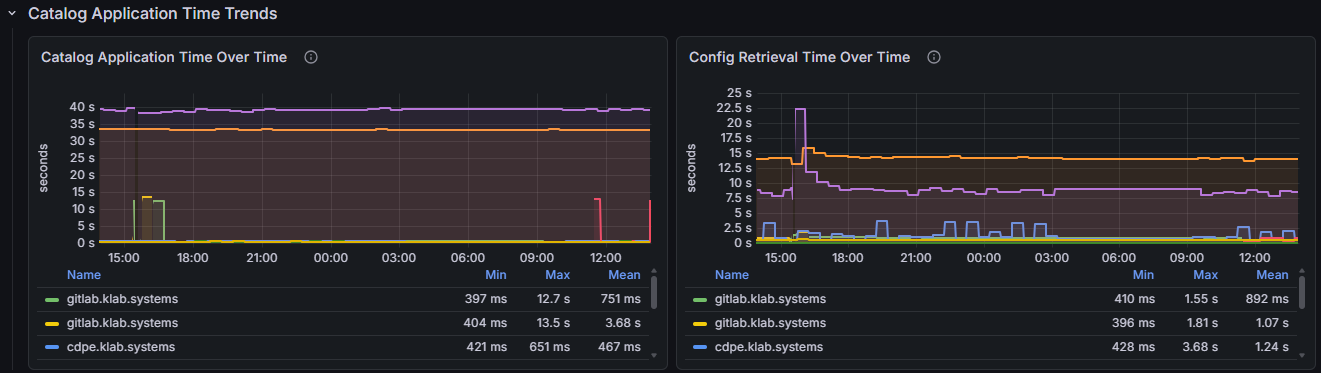
What this tells you:
| Catalog Application Time Over Time | Correlate spikes with git commit timestamps. A spike immediately following a deployment confirms the new code introduced expensive resources. Persistent elevation after the spike stabilizes means the cost is structural, not transient. |
| Config Retrieval Time Over Time | Sustained increases across all nodes simultaneously point to a PE server bottleneck (JVM heap, database pressure, or compiler overload). Increases on a single node suggest agent-side network issues. |
Full Dashboard Snapshot
Download
Download the Puppet Data Connector Forge Module
Want to try it in your environment? Download the premium Forge module now.
Wrap-up
The Puppet Observability Data Connector provides valuable information about the Puppet agent nodes across your environment. Visualizing these metrics gives organizations key insights, allowing team members to identify problems, measure performance, and track changes. The dashboards shown here are just one of the many ways to drive value from your Puppet metrics.
For assistance driving value from your Puppet metrics please ask your account team about how Professional Services could help you with dashboards that match your environment and operational priorities.
Blog
Visualize Your Puppet Data in Grafana with the Observability Data Connector
Tutorial: how to use your Puppet infrastructure data in Grafana.